In 2015, criminal defense attorneys, Brent Mayr and Tommy Carter, working with the assistance of forensic toxicologist, Amanda Culbertson, were called upon to review a case of an individual arrested and charged with DWI in El Paso, Texas. A police officer had stopped and arrested the person and, acting pursuant to a No Refusal Program, obtained a search warrant and had the person’s blood drawn. The vials of blood were delivered to the Texas Department of Public Safety’s El Paso Regional Crime Lab where the blood was to be tested by analysts to determine the blood alcohol concentration. After several months, the lab released an official lab report stating that the blood alcohol concentration was over the legal limit.
While most individuals would think they had no choice but to plead guilty, this individual insisted that he was not intoxicated and asked Mayr, Carter, and Culbertson to take a closer look. Mayr and Carter obtained an order from a judge requiring the crime lab to produce all records related to the testing of their client’s blood. The records revealed what appears to be one of the most egregious acts that a laboratory could commit: dry-labbing.
“Dry-labbing” is a term used where a lab reports that they performed a test producing a result when, in fact, no test was ever performed or the data was manipulated in a way contrary to what naturally occurs. Stated differently, it is where a lab reports “fake results.”
How Blood is Tested to Determine BAC
To understand the gravity of and provide clarity to this issue, one needs to be familiar with some of the basics of how blood is tested to determine an alcohol concentration.
A person’s blood is tested within labs like the DPS El Paso Regional Crime
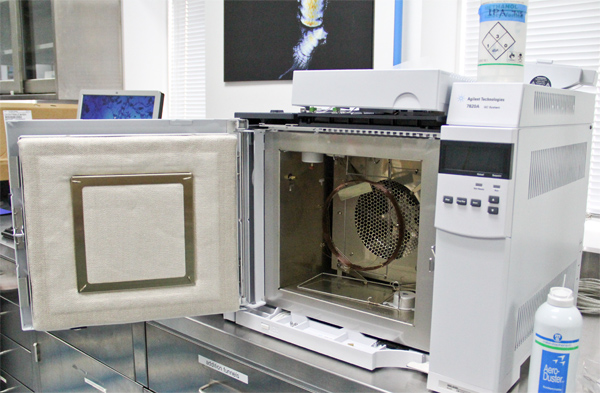
Gas chromatograph with door open to show columns inside.
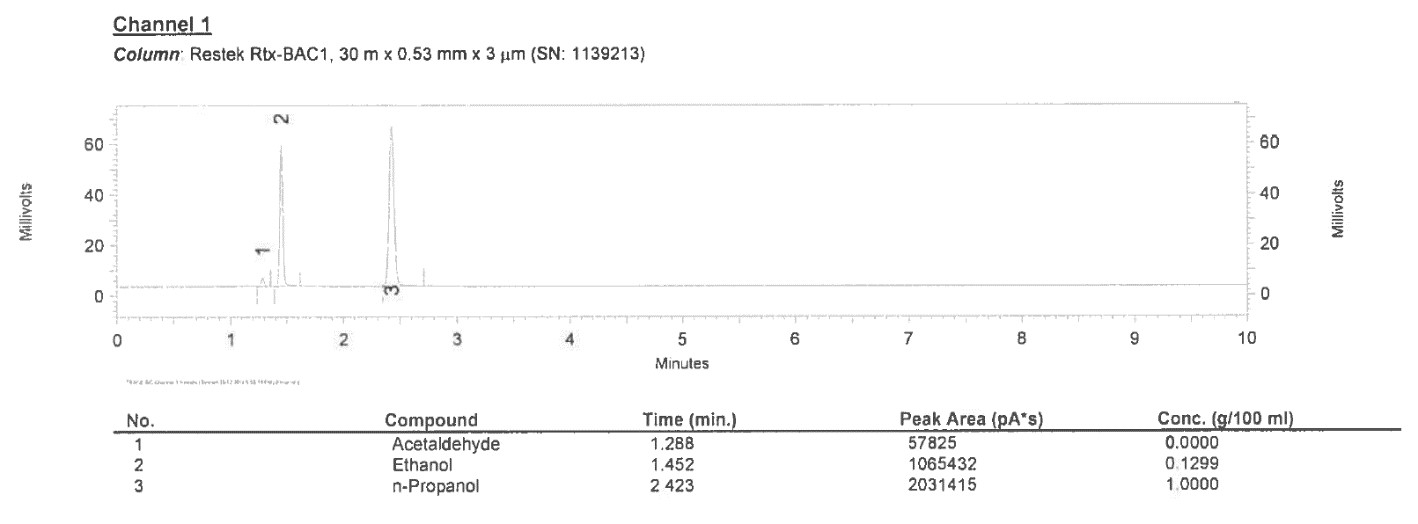
Lab using a process known as gas chromatography. With this process, blood is tested using an instrument known as a gas chromatograph which separates compounds like alcohol from within the blood. This separation process takes place within columns which look like coils of wire but are actually hollow and allow gas from of the blood to pass through it with the assistance of helium gas. As the alcohol separates from other substances and comes out at the end of the column, a device called a flame ionization detector measures the quantity of the substance, producing a chromatogram. The chromatogram looks like an EKG readout, but with a “spike” that depicts the quantity of the substance. The spike (which is actually a curve) is measured to calculate the area beneath it, producing what is referred to as an area count or the peak area. Applying a formula derived from the calibration process to this area produces the final reported result of alcohol concentration within the blood.
When blood is tested using this process, it is equally important to understand that it is not just one sample of blood being tested or even one person’s blood being tested during a given time. With labs like the DPS El Paso Regional Crime Lab having to test multiple defendants’ blood, to maximize efficiency, individuals’ blood is tested in batches. An exact quantity of a person’s blood is taken from the vial which their blood is originally drawn into and placed into separate, smaller vials and loaded into a tray along with other defendants’ blood. From those vials, the blood will be heated up to allow alcohol and other volatile compounds to move into a gaseous form and then pass through not one, but two columns, producing two results. Furthermore, to ensure quality, this process will be done twice, producing a total of four results for each defendant. Equipment attached to the gas chromatograph called autosamplers take each defendant’s vial and inject it into the instrument one after the other until all of the vials are tested. In some cases, up to 50 different defendants’ blood can be tested in one batch, the entire process taking several hours and sometimes more than one day.
What the Records Showed Happened in this Case
In the specific case that Mayr, Carter, and Culbertson reviewed, the individual’s blood was initially tested in a batch that started on February 7, 2014. The blood was separated into vials and loaded into a tray along with other defendants’ blood in a specific order and the testing process was initiated with vial after vial tested one after the other. A total of 32 defendants’ blood was to be tested in this batch. During this testing run, however, a significant error occurred when the helium gas tanks ran out of the gas needed to move the substances to be measured from within the blood through the columns. Lab personnel restarted the batch over two days later where it left off and the instrument produced chromatograms like the one depicted above — four for each defendant’s blood — with reported peak areas and resulting alcohol concentrations. However, because of the error, the results were invalid and could not be used. The blood would have to be prepared again and retested.
On March 12, 2014, the entire batch from February 7, 2014 was allegedly reanalyzed in its entirety and exact sequential order. Once again, an individual’s blood was to be prepared by placing known quantities into separate vials and loading them into a tray along with other defendants’ blood in a specific order. The testing process was to be initiated with vial after vial tested one after the other, purportedly producing chromatograms like the ones depicted above — four for each defendant’s blood — with reported peak areas and resulting alcohol concentrations.
While the reported alcohol concentrations were slightly different, Culbertson discovered a shocking occurrence in the peak areas (the actual measurement made by the instrument). In 55 out of the total of 64 vials of individual defendants’ blood (2 vials per 32 defendants), the peak areas for all substances detected in the samples obtained in the February 7 batch run were identical to the peak areas for all substances detected in the samples shown on the chromatograms from the second batch run on March 12. Even more unusual, the peak areas for one defendant had identical peak areas in the previous run but the order was reversed, that is, the peak areas for vial 1 of 4 was appearing as 3 of 4, and 2 of 4 was appearing as 4 of 4, and so on.
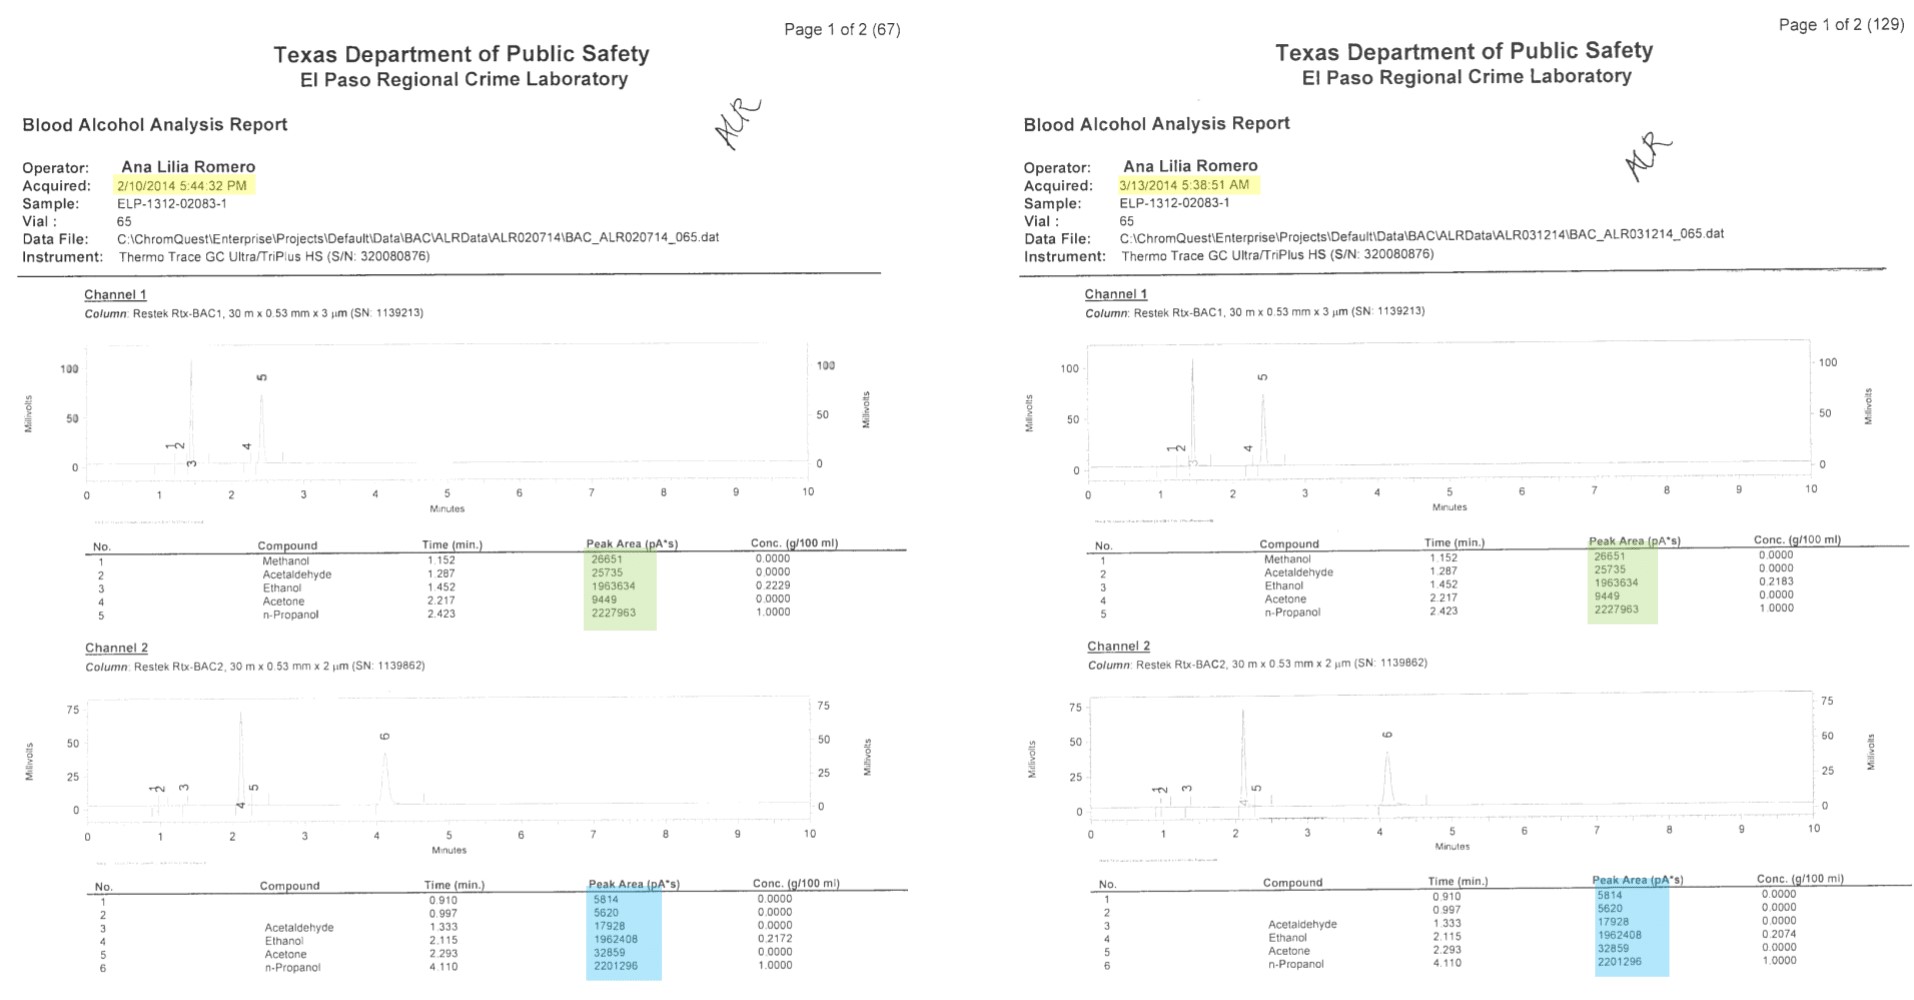 By way of example, above are two chromatograms produced for the same defendant (ELP-1312-02083). The chromatogram on the left was produced in the invalid testing run on February 7. This sample was run through the two columns in the chromatograph instrument, producing two sets of peak area measurements (Channel 1 on the top, Channel 2 on the bottom). Highlighted in green are the peak areas for each detected substance in Channel 1 (column 1). Highlighted in blue are the peak areas for each detected substance in Channel 2 (column 2). The chromatogram on the right was purportedly produced in the second “re-test” run on March 12. Again, the sample was purportedly run through the two columns in the chromatograph instrument, producing two sets of peak area measurements (Channel 1 on the top, Channel 2 on the bottom). As one can see, the peak areas for each detected substance in Channel 1 (column 1) and Channel 2 (column 2) are identical to the peak areas from the invalid chromatogram from February 7 on the left.
The peak areas are a very distinct, finite, minute measurement which, in the case of alcohol (ethanol) and n-propanol (the internal standard), are typically 7 digits in length. The chances of analyzing another sample that results in all 7 digits of the area counts being identical to any other case, in any other batch, is extremely small. But having all digits of peak areas for acetaldehyde, ethanol, acetone, methanol, and other unidentified peaks being identical to a previous run for 55 out of 64 defendant samples is beyond measure. In other words, there is no way that what was seen in these two batches is the result of coincidence or a random event.
To put it in perspective, consider the lottery where a person will pick 6, non-identical numbers ranging from 1 to 50. The odds of matching all 6 numbers are 1 in about 14 million. Here, with just one defendant, there were 10, non-identical numbers ranging within approximately 1000 units of one another (the various peak areas for each compound). For the peak areas in the March 12 run to match all 10 of those numbers from the February 7 run, the odds would have been somewhere in the range of 1 in 516,674,722,723,674,427,559,387,119,826 (that’s 516 octillion). And that is just for one vial of blood. Here, there were 55 out of 64 vials where the numbers matched. So what other explanation is there for the measurements to turn out exactly the same?
Dry-Labbing: The Fake Results
While the results from the February 7 testing run were invalidated due to the error with the helium gas, the results from March 12 appeared, at first glance, to be error-free. They were purportedly reviewed by another analyst in the lab, approved, and, subsequently, the DPS El Paso Regional Crime Lab released the official lab reports showing each individual’s blood to have a certain quantity of alcohol and, for almost all of them, an alcohol concentration over the legal limit of 0.08.
However, upon closer examination of the records discussed above, it unequivocally appears in all senses that the results were faked with the peak areas from the invalid February 7 run “copied and pasted” into the chromatograms for the purportedly valid March 12 run. It was scientifically impossible to have actually tested the blood and have the measurements come out identical to the February 7 measurements.
The Real Consequences: Numerous Wrongful Convictions
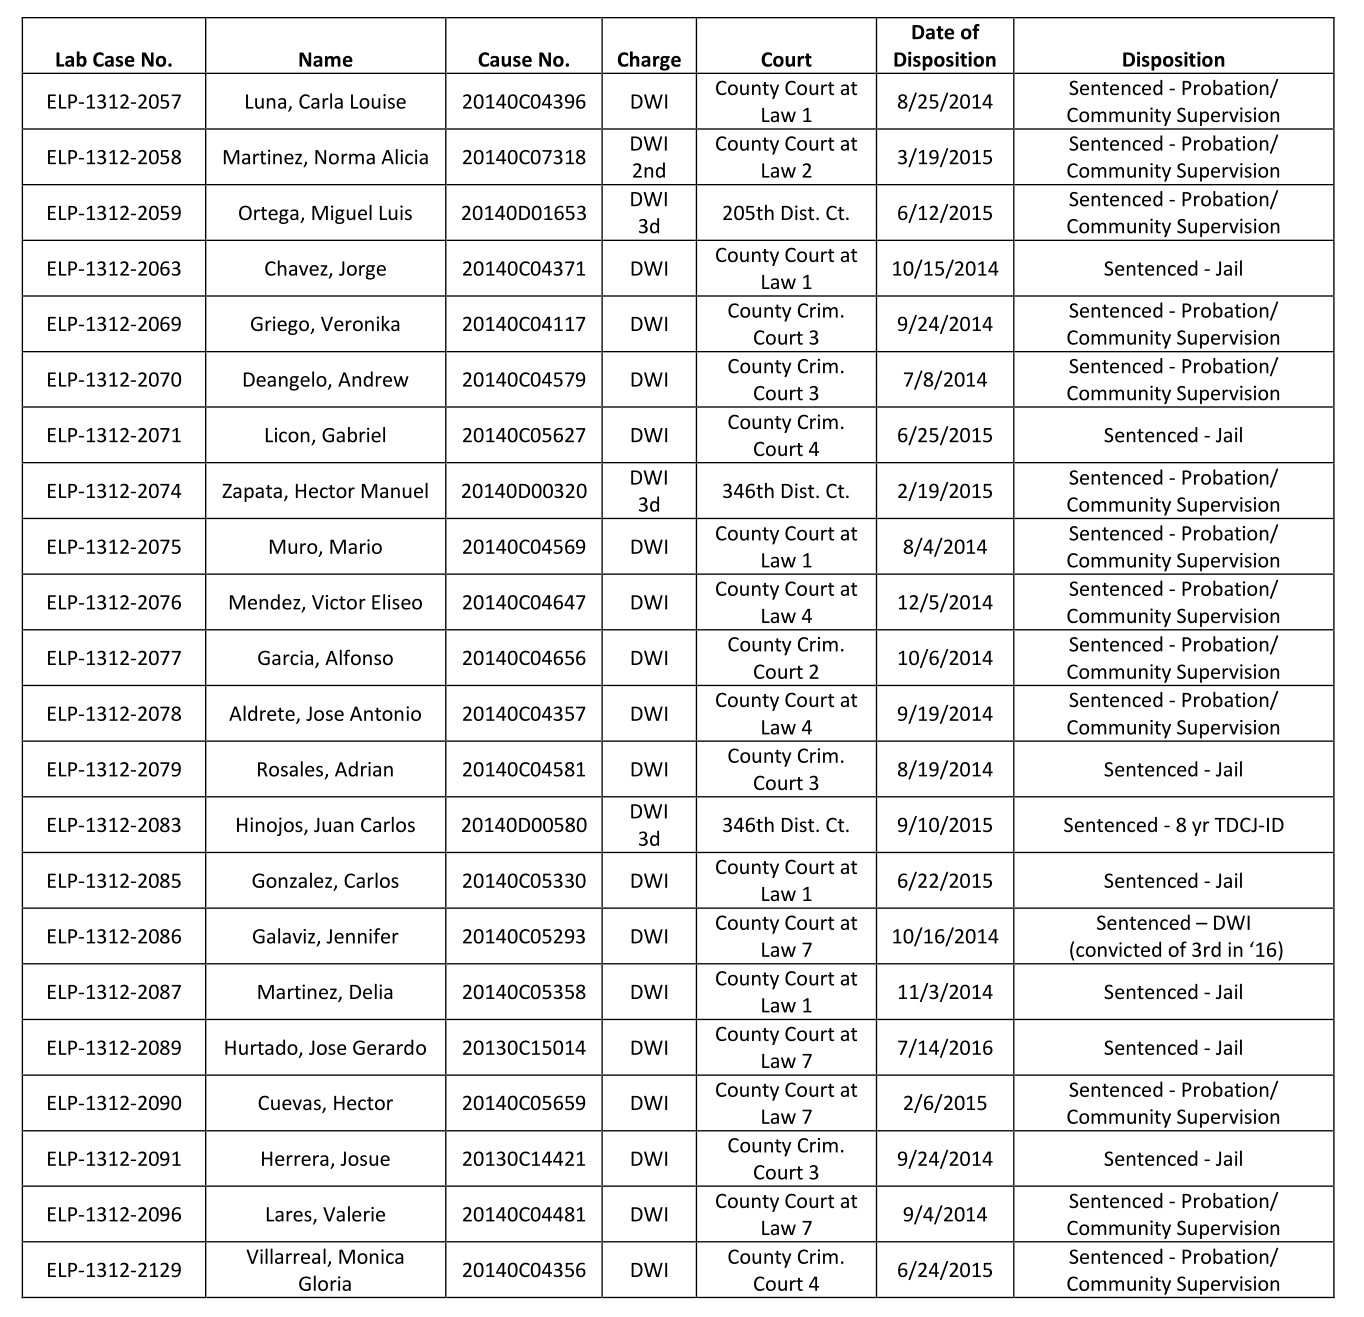
Because this was not discovered for just one of the defendants whose blood was “fake tested,” but for almost all other defendants whose blood was tested in this batch, multiple individuals have been wrongfully convicted. Below is a list of the individuals whose blood was tested in this batch — each one presumably presented with the purportedly damning evidence of their blood alcohol concentration being over the legal limit and making a decision to plead guilty — a decision based on a false premise.
 While Mayr, Carter, and Culbertson have uncovered unequivocal evidence of “fake results” for these individuals, it is also highly possible that many others have been affected by this serious misconduct. Prior to then and since this discovery, hundreds, if not thousands of individual defendants have been presented with blood alcohol reports from the DPS El Paso Regional Crime Lab purportedly showing them to have alcohol concentrations above the legal limit and, based on those results, pleaded guilty or been found guilty after a trial. This discovery could potentially be the tip of the iceberg as the same analyst who was responsible for producing the “fake results” discussed here also tested defendants’ blood in hundreds of other cases. The same supervisors and lab personnel who were responsible for reviewing the work of the analyst and approving the “fake results” failed to discover the misconduct and errors and, even worse, failed to notify prosecutors, defense attorneys, and judges.
If you are one of the individuals listed above or have otherwise been arrested for and charged with driving while intoxicated, had your blood drawn and tested by the DPS El Paso Regional Crime Lab, presented with a report from that lab showing that you were over the legal limit, and either pleaded guilty or been found guilty at trial, we encourage you to contact us at 855-684-4589 (855-NT-GILTY) or by submitting the form at the bottom of this page to discuss your legal rights and options.
